1. View demo examples
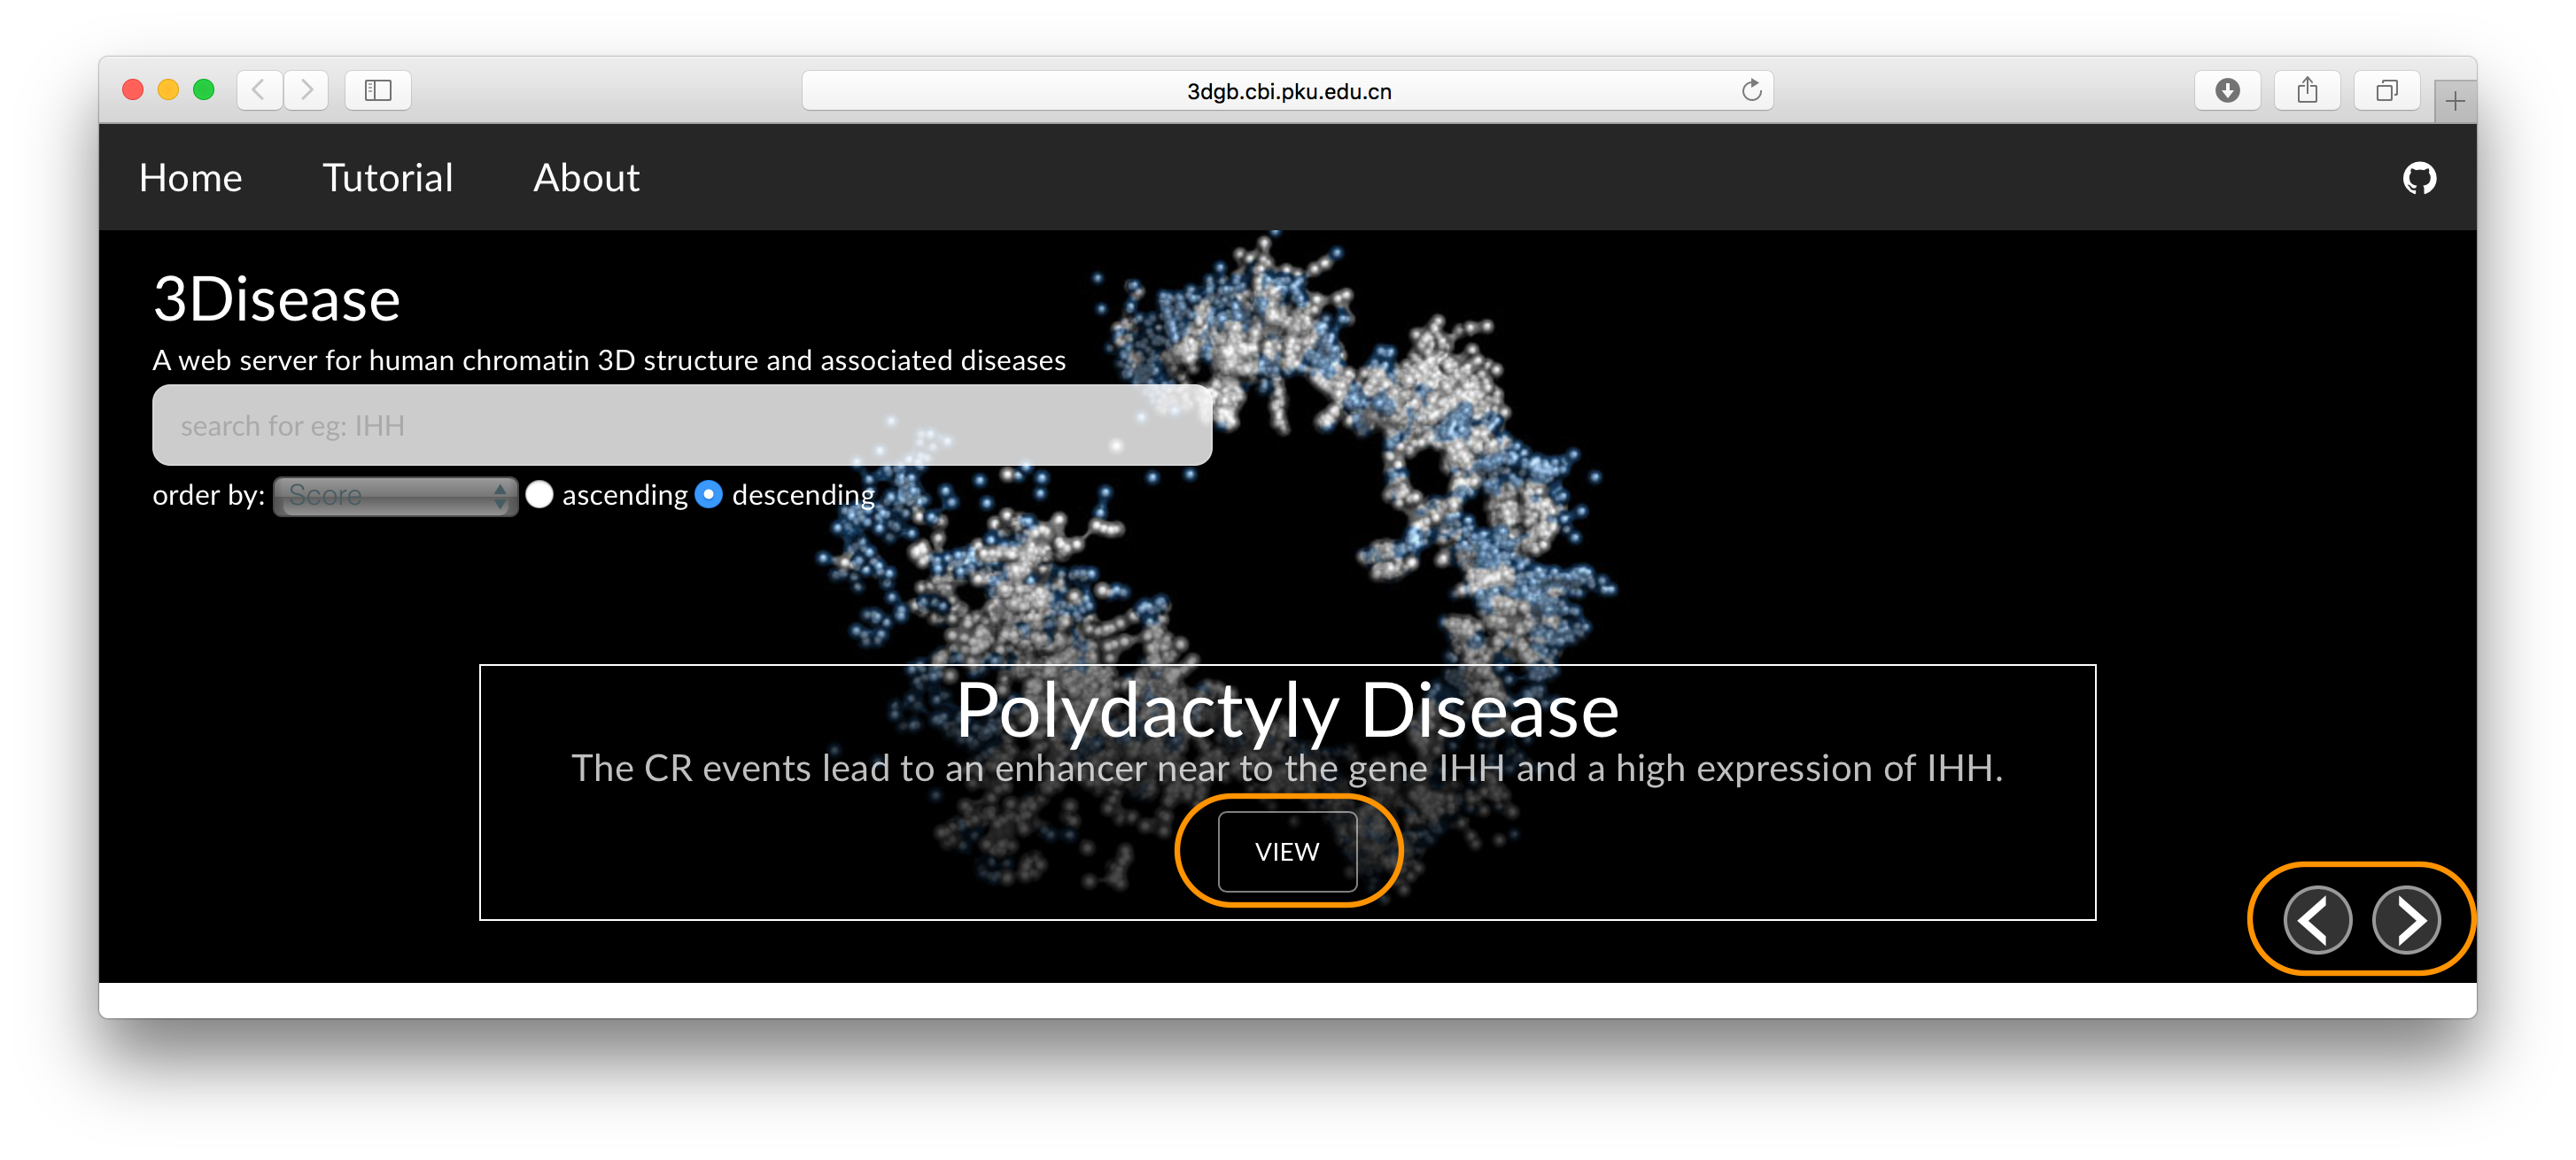
Clicking on the VIEW button will pop up a new window about the details of the current CR example. The demo example will change over time and you can click the arrow button to change to the previous or next example.
2. Search gene or disease names
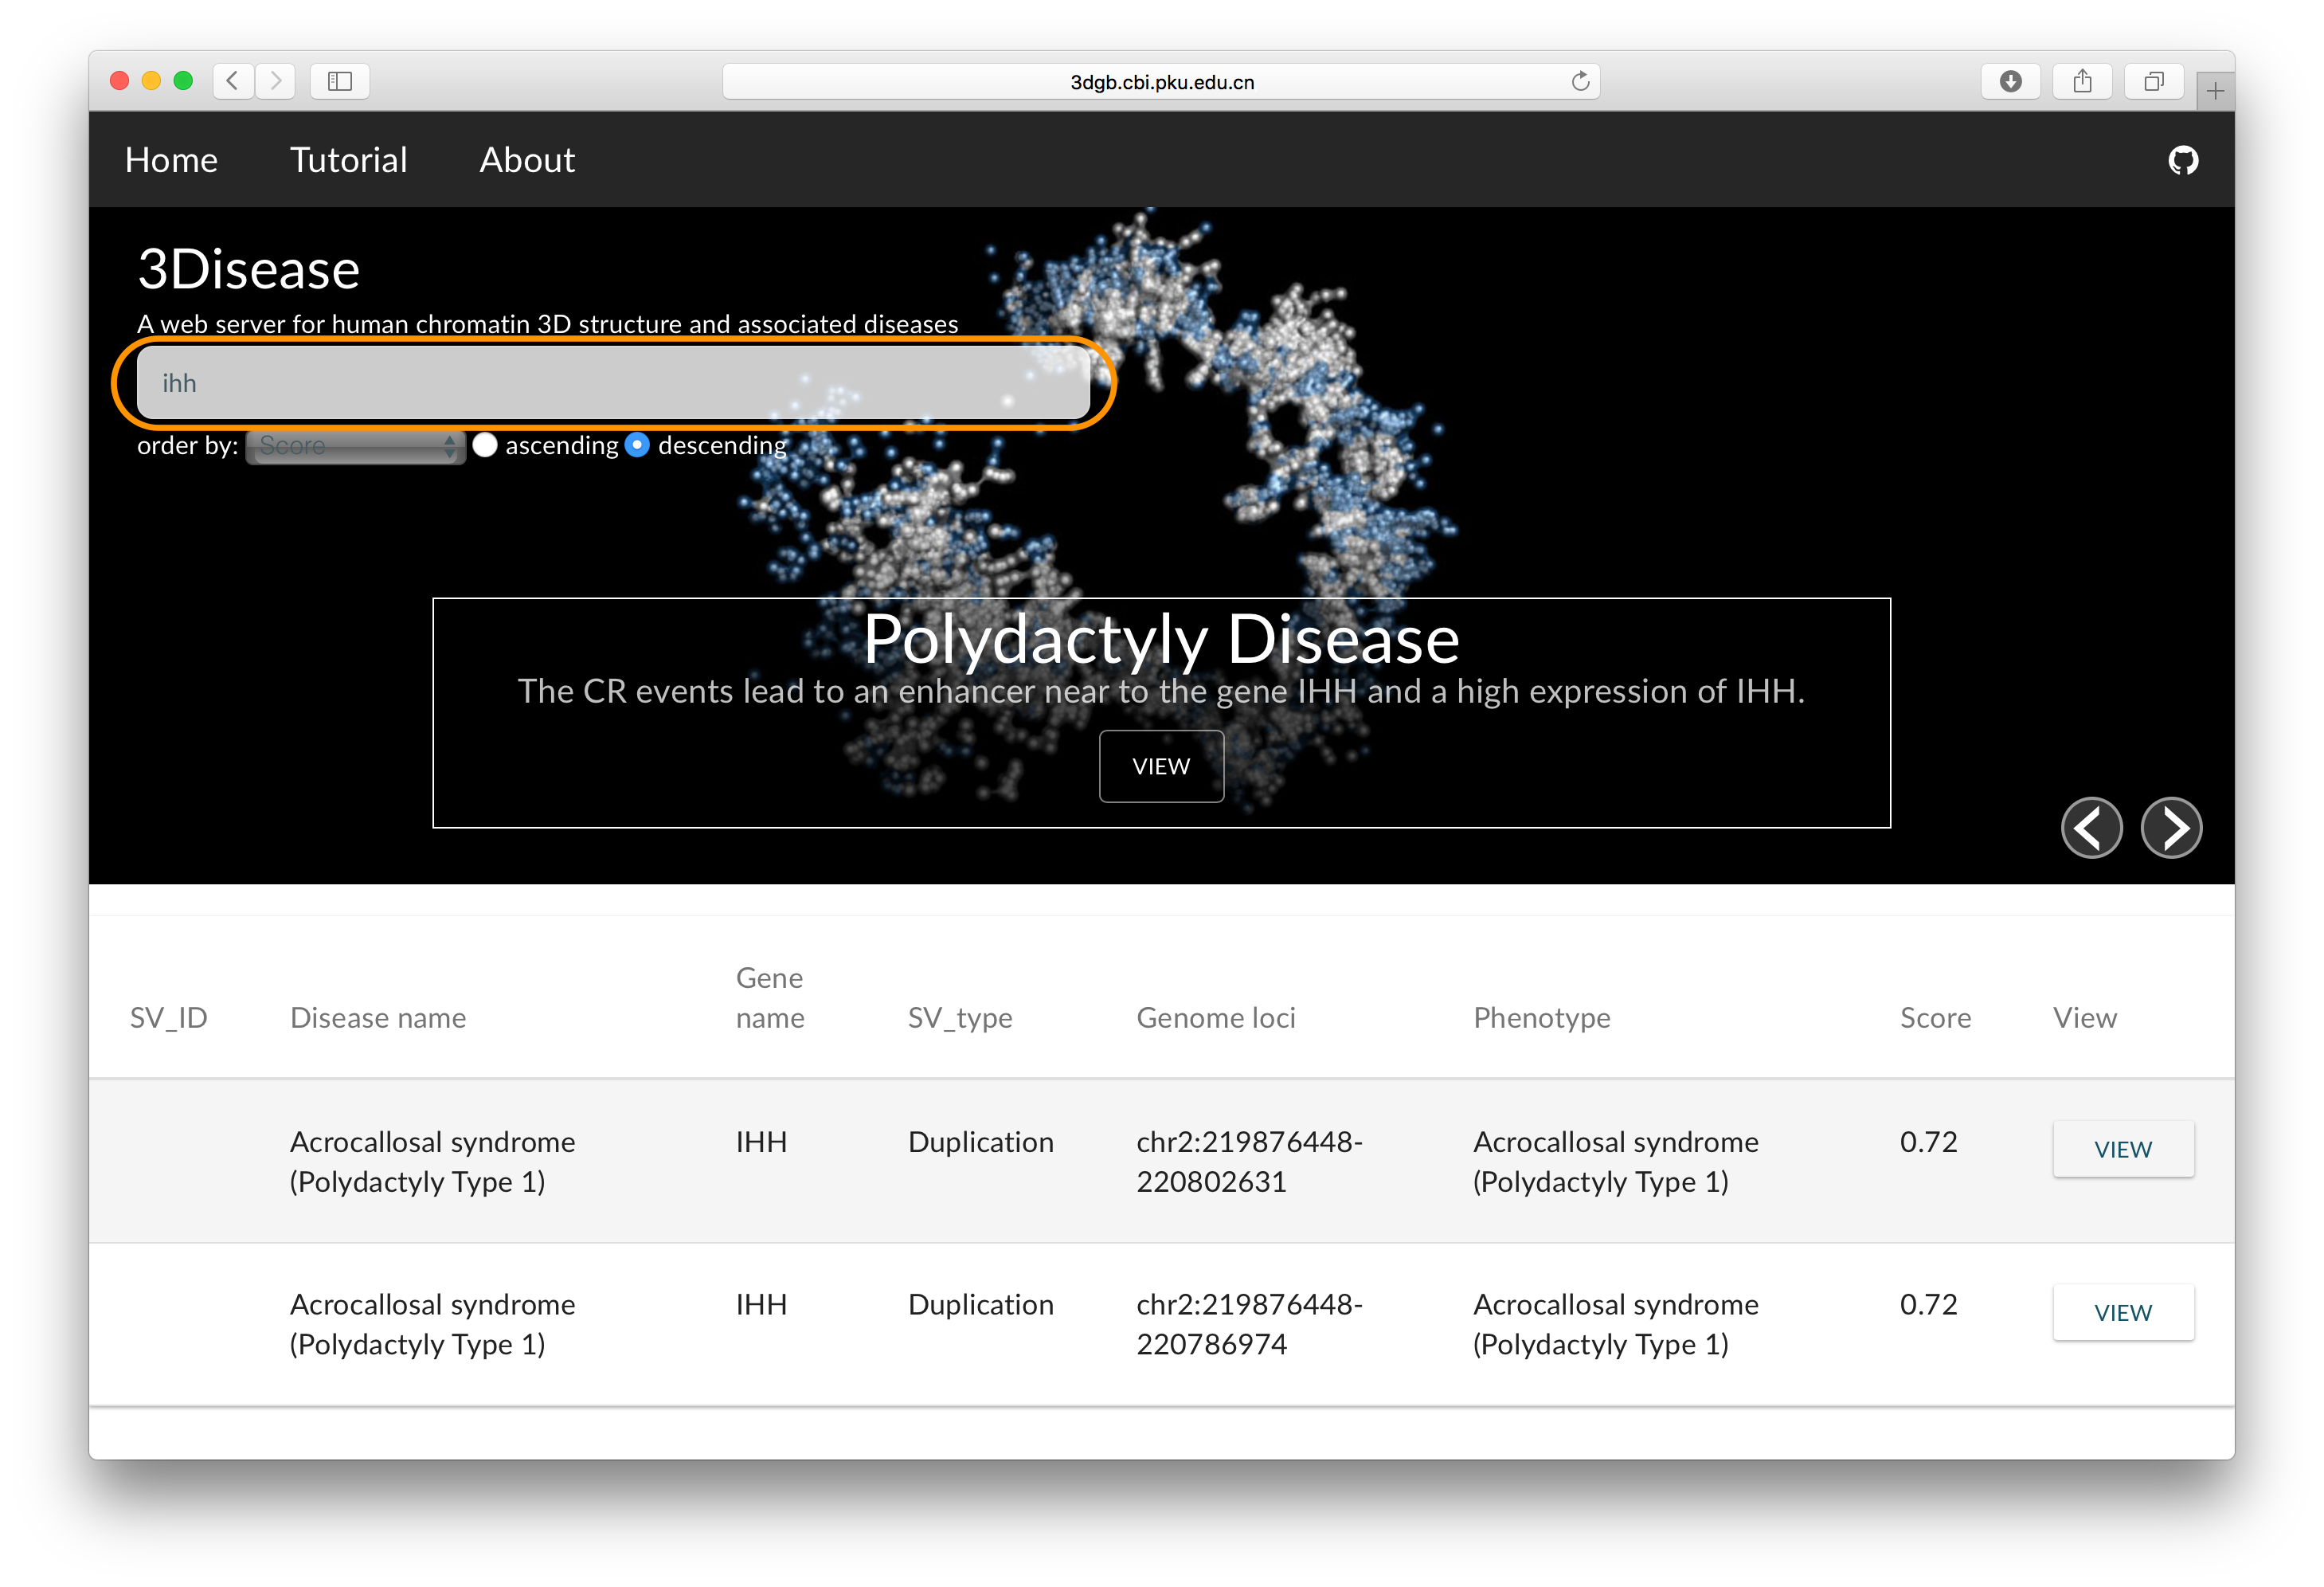
Type in an interested gene name, disease name or CR ID in the search panel. The query results containing the search parameters will be displayed below the search box.
3. Sort query results
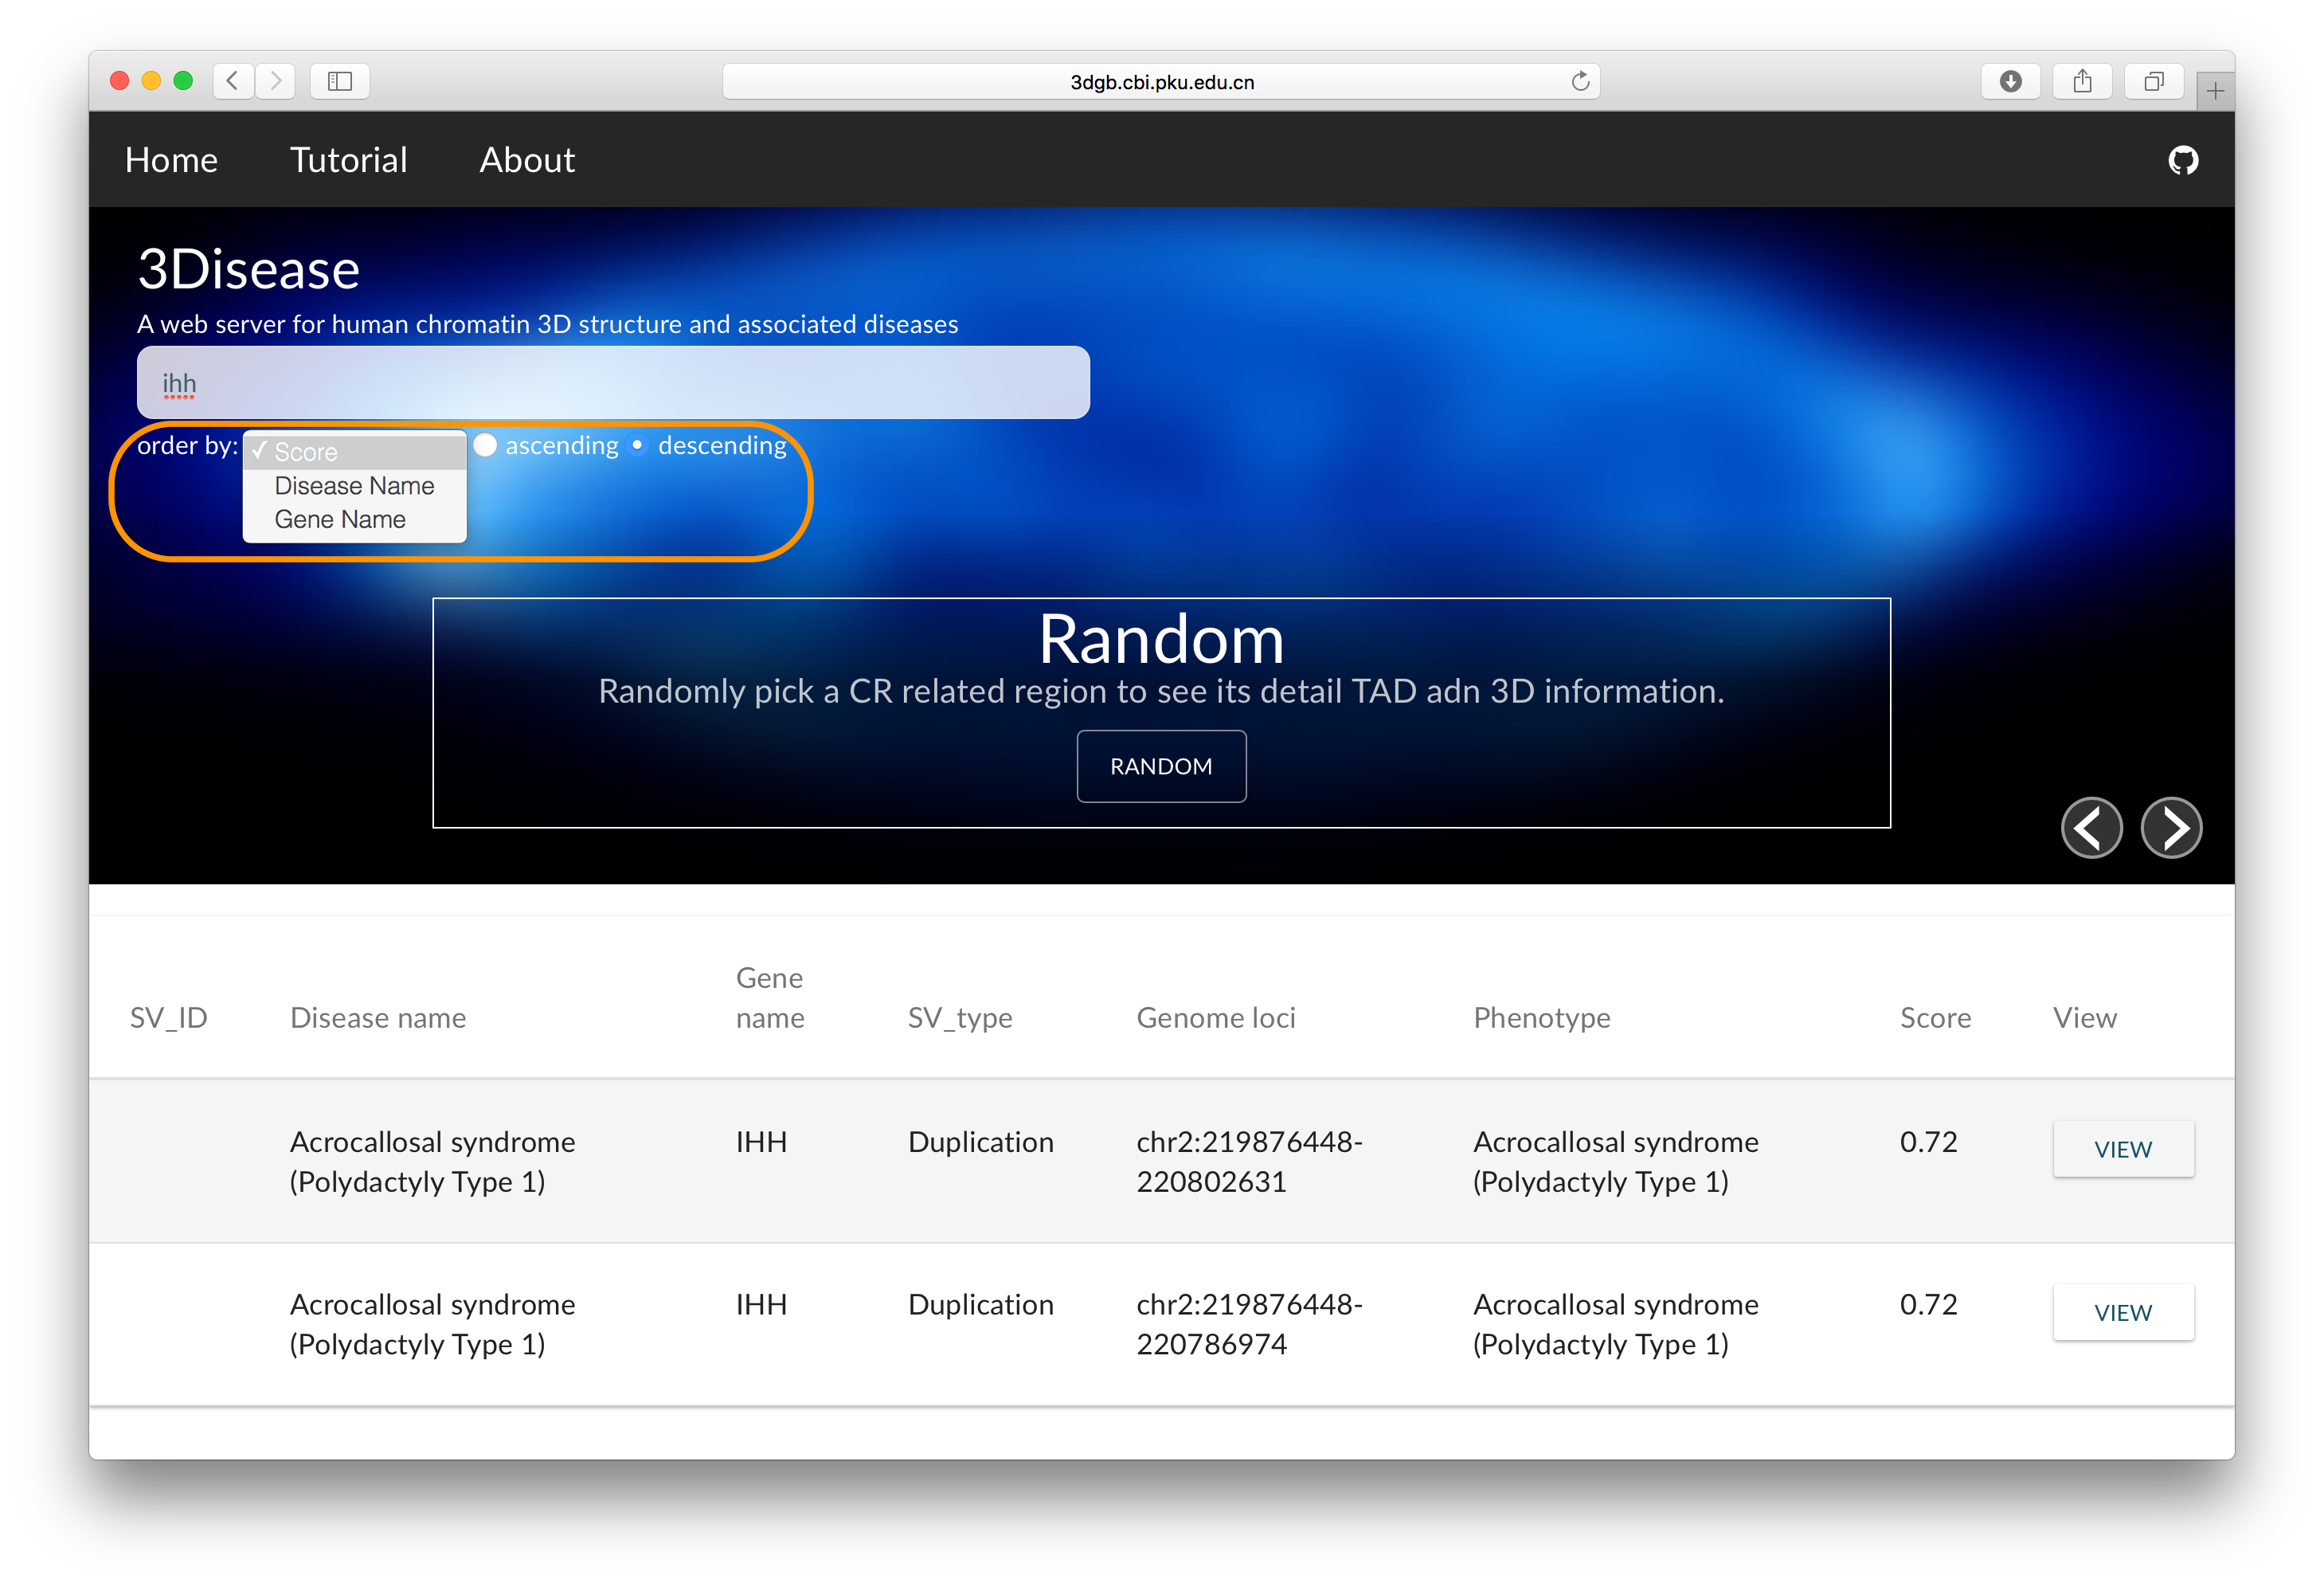
The list of the search results can be ordered by SI score, disease name or gene name by ascending or descending order.
4. View CR details
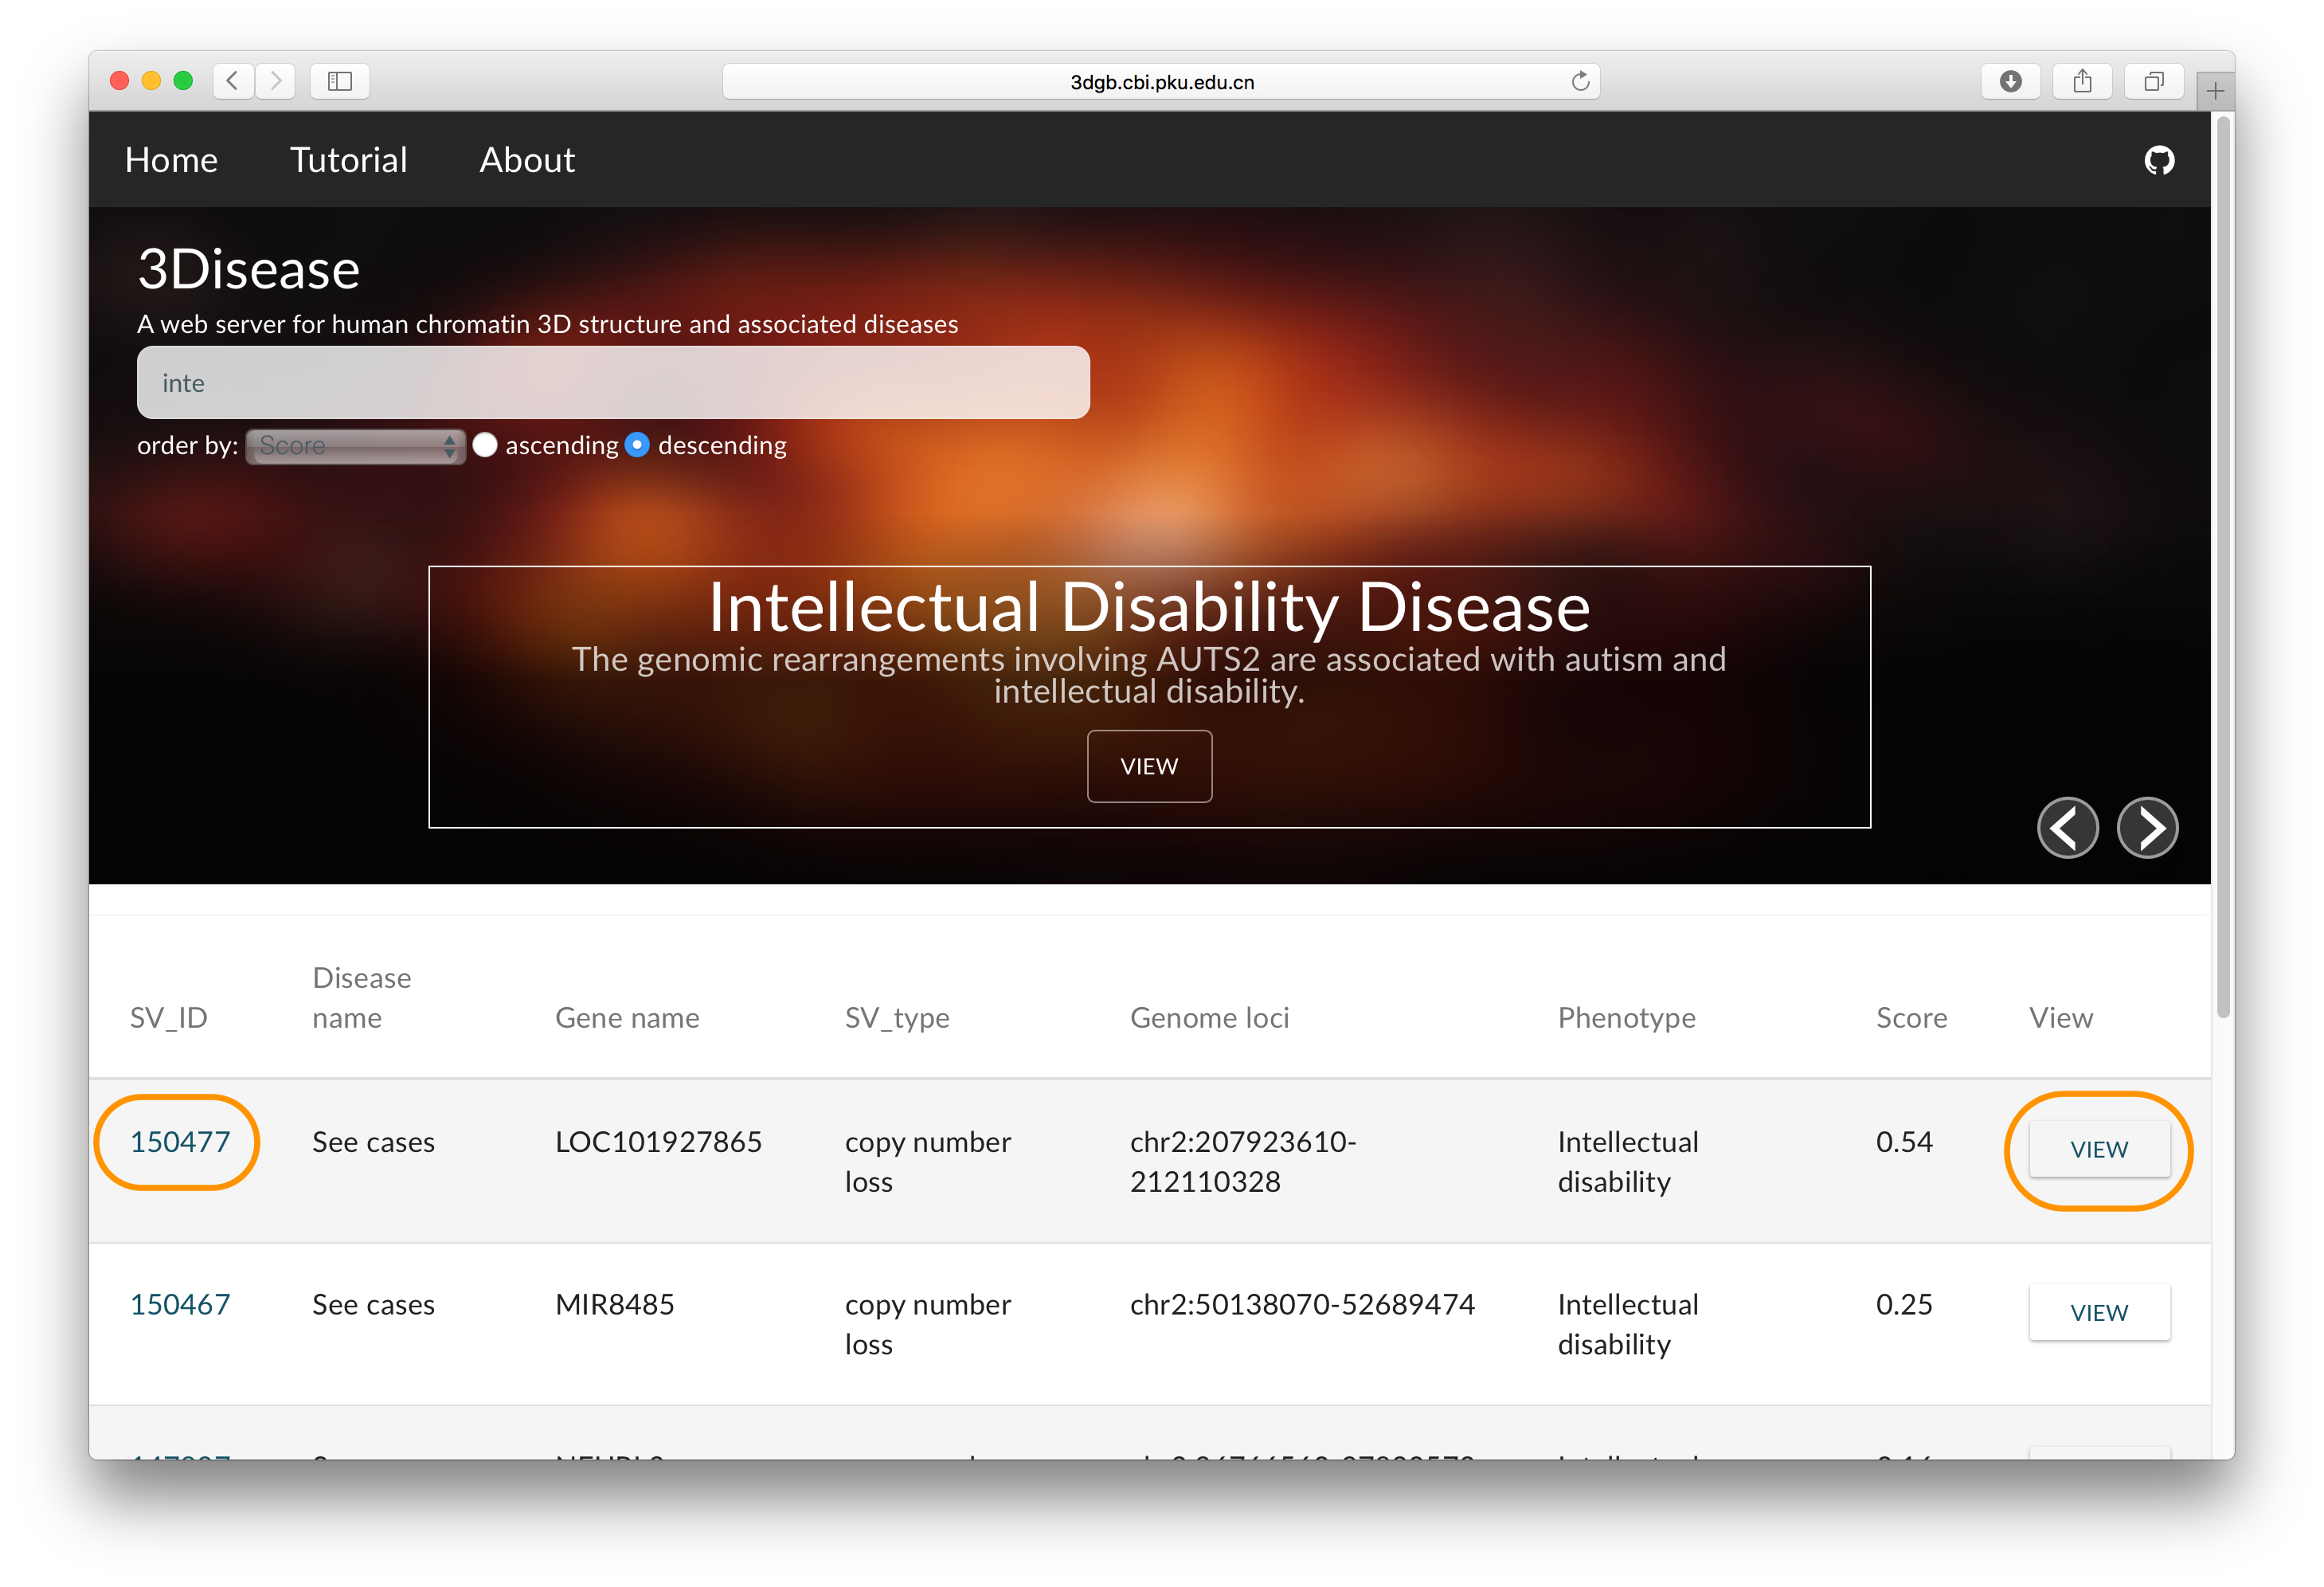
Clicking on "CR ID" will link to the ClinVar database entry when available. Clicking on a View button will pop up the TAD and 3D model images for the CR region.
5. Visualisation of the CR region
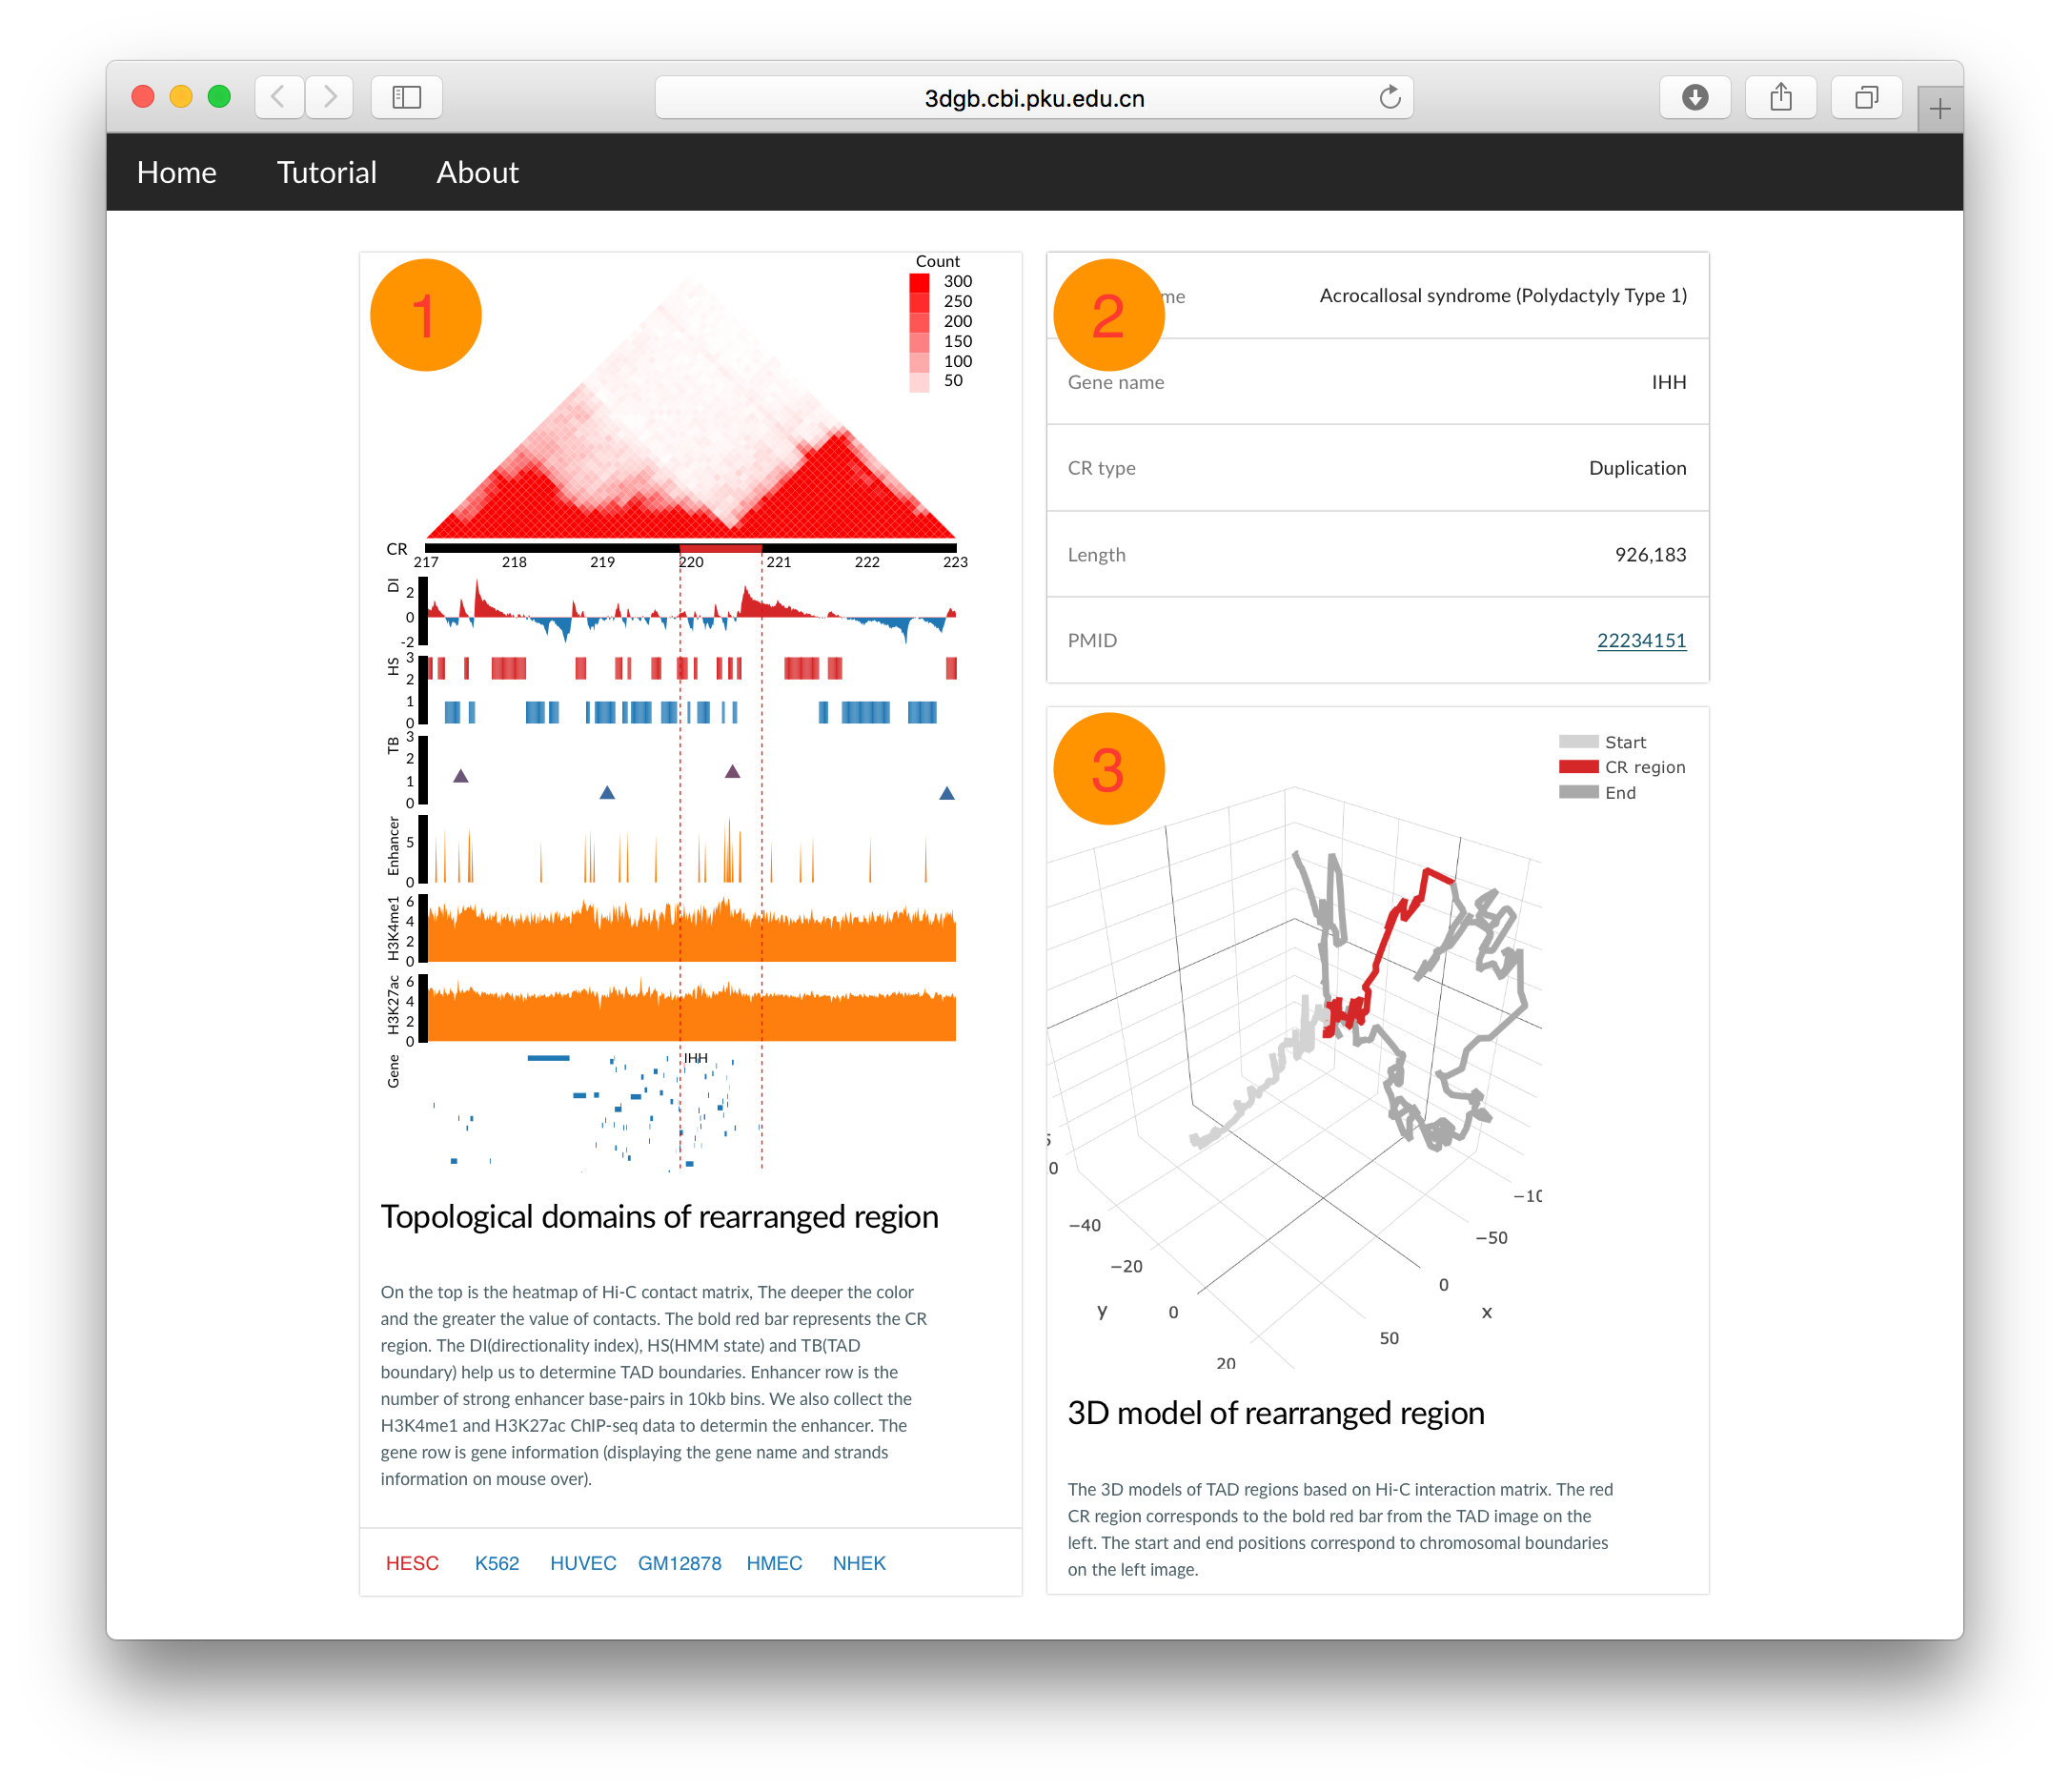
The details of the CR region are deplayed in three areas. The first displays the TAD information. The second displays gene and disease inforamtion. The third displays the 3D model of the TAD region.
6. Interactive visualization of the Hi-C data
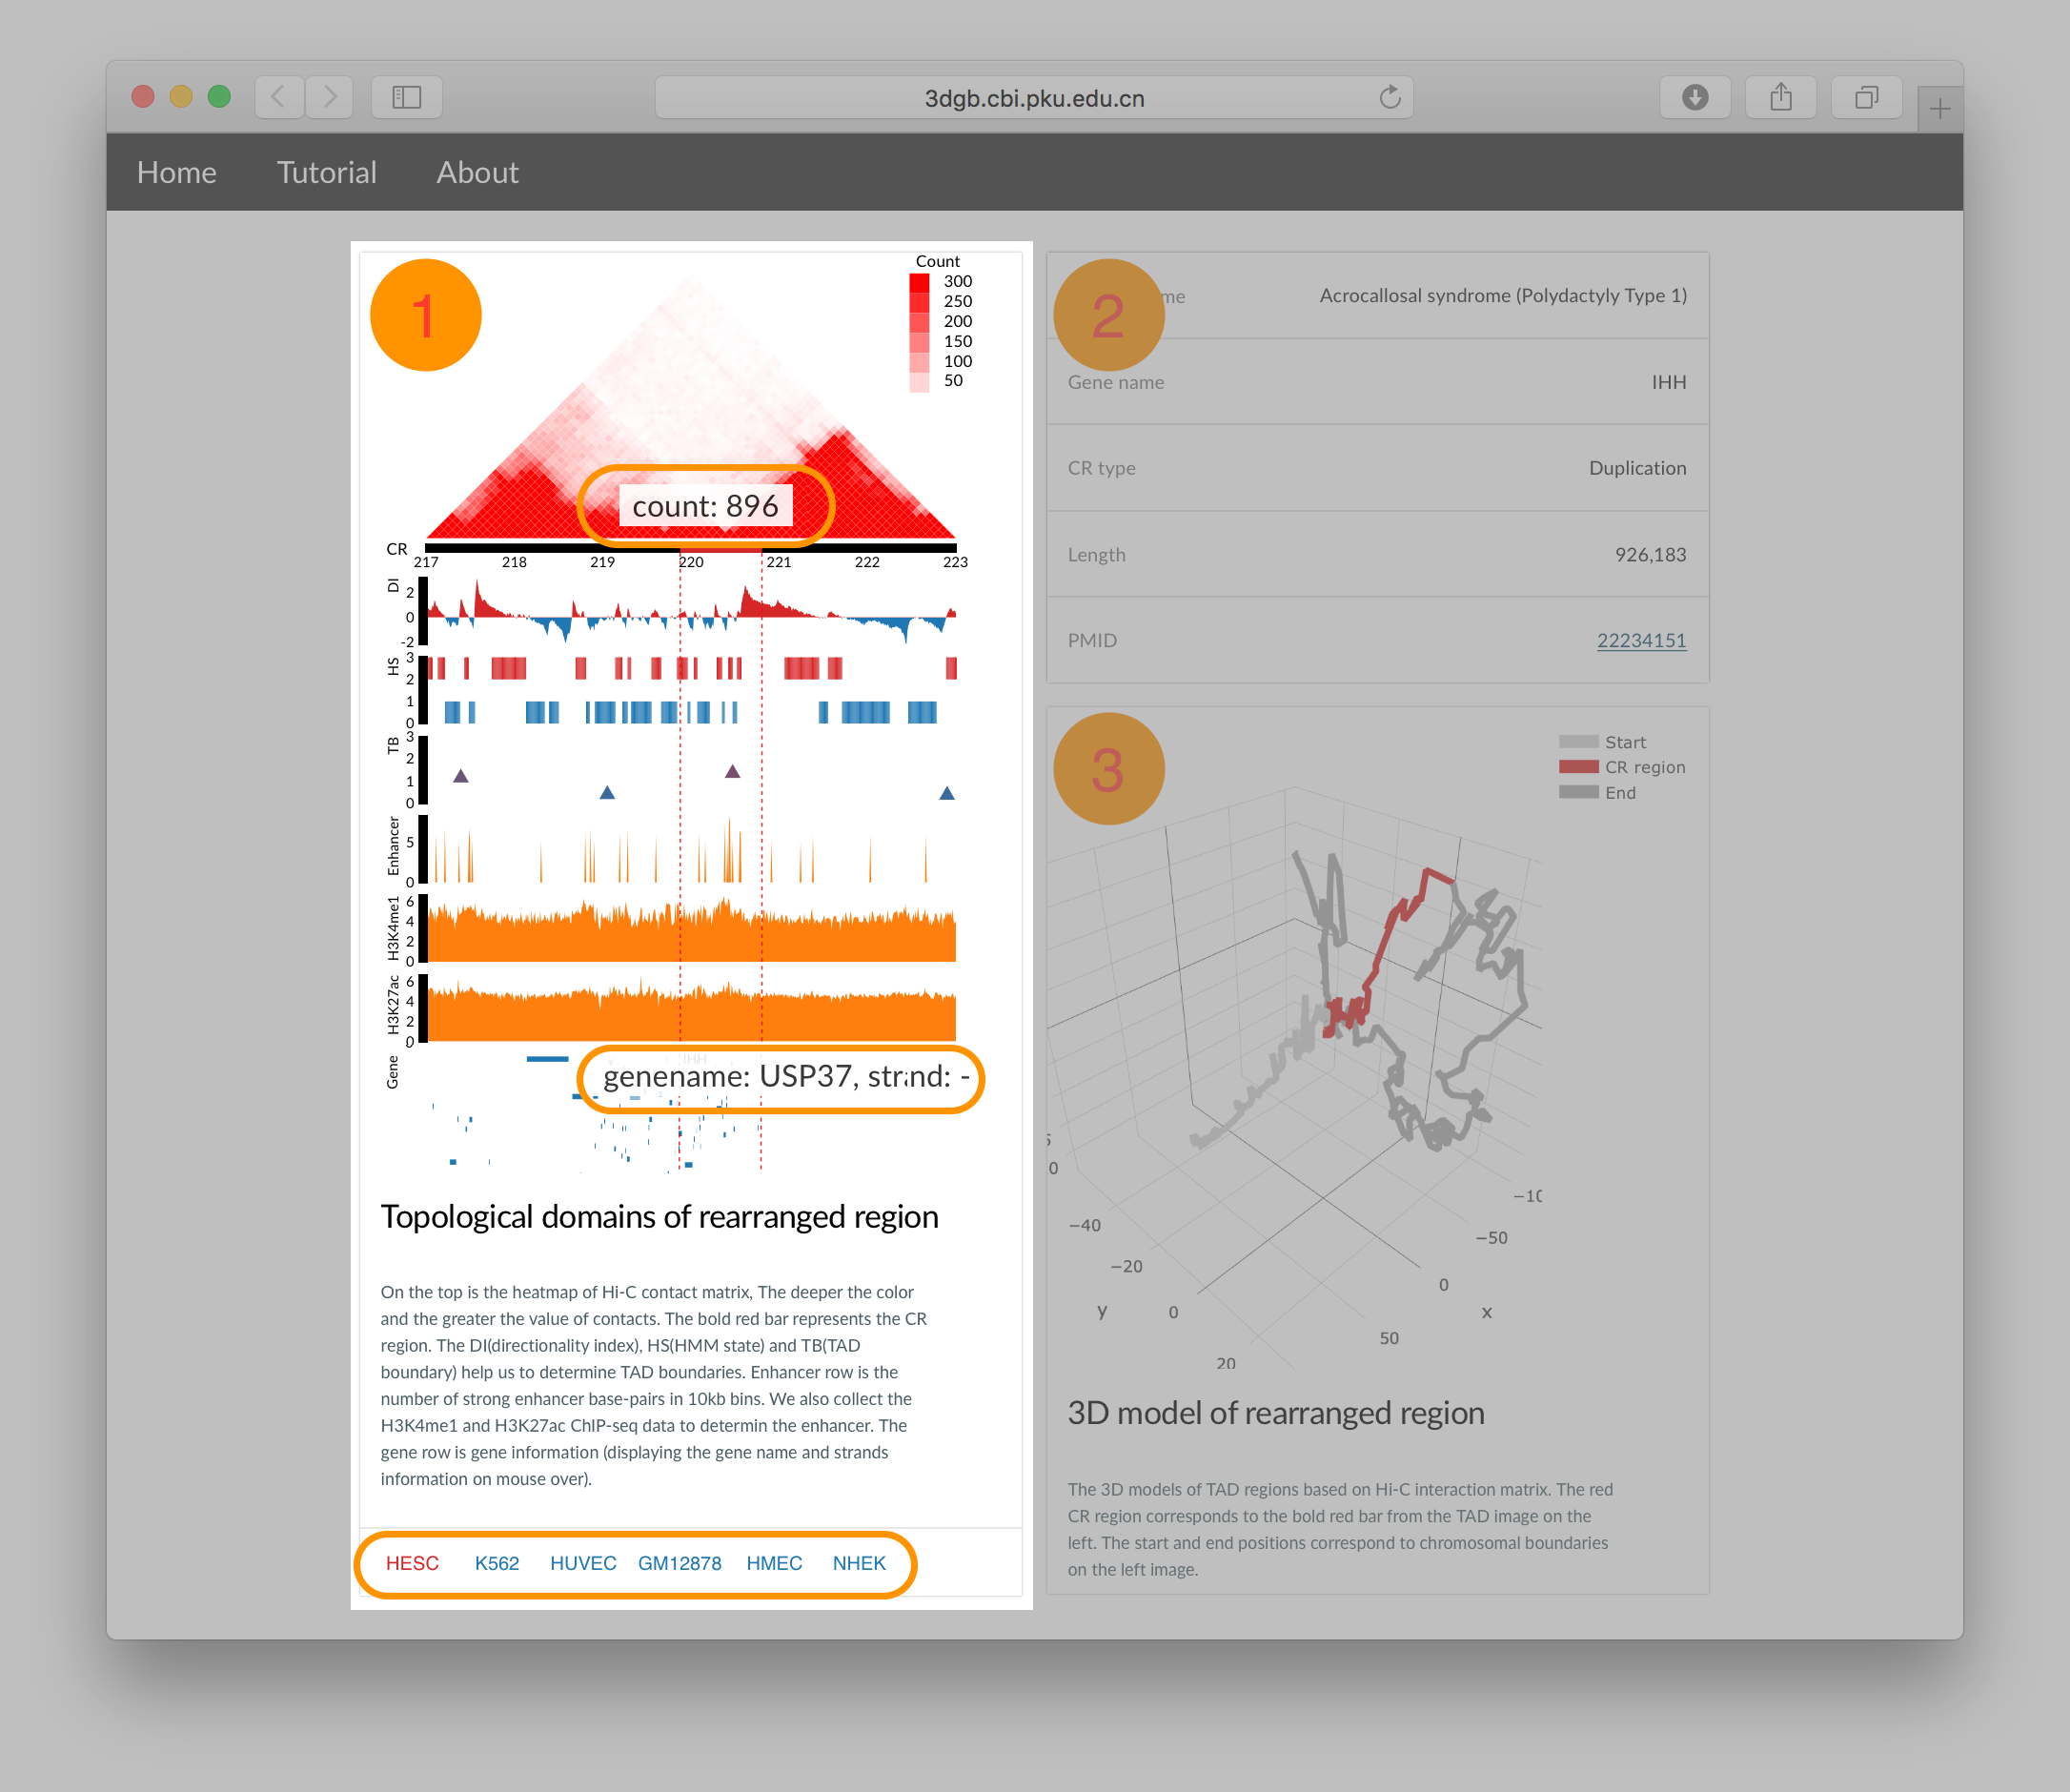
Moving mouse over the TAD heatmap will show the interaction read counts for a pair of bins. Moving mouse over the Gene track will show the name and strand information. Click the "cell line" buttons on the bottom will change to Hi-C and 3D model images using the corresponding cell line`s data.
7. Interactive visualization of the 3D model
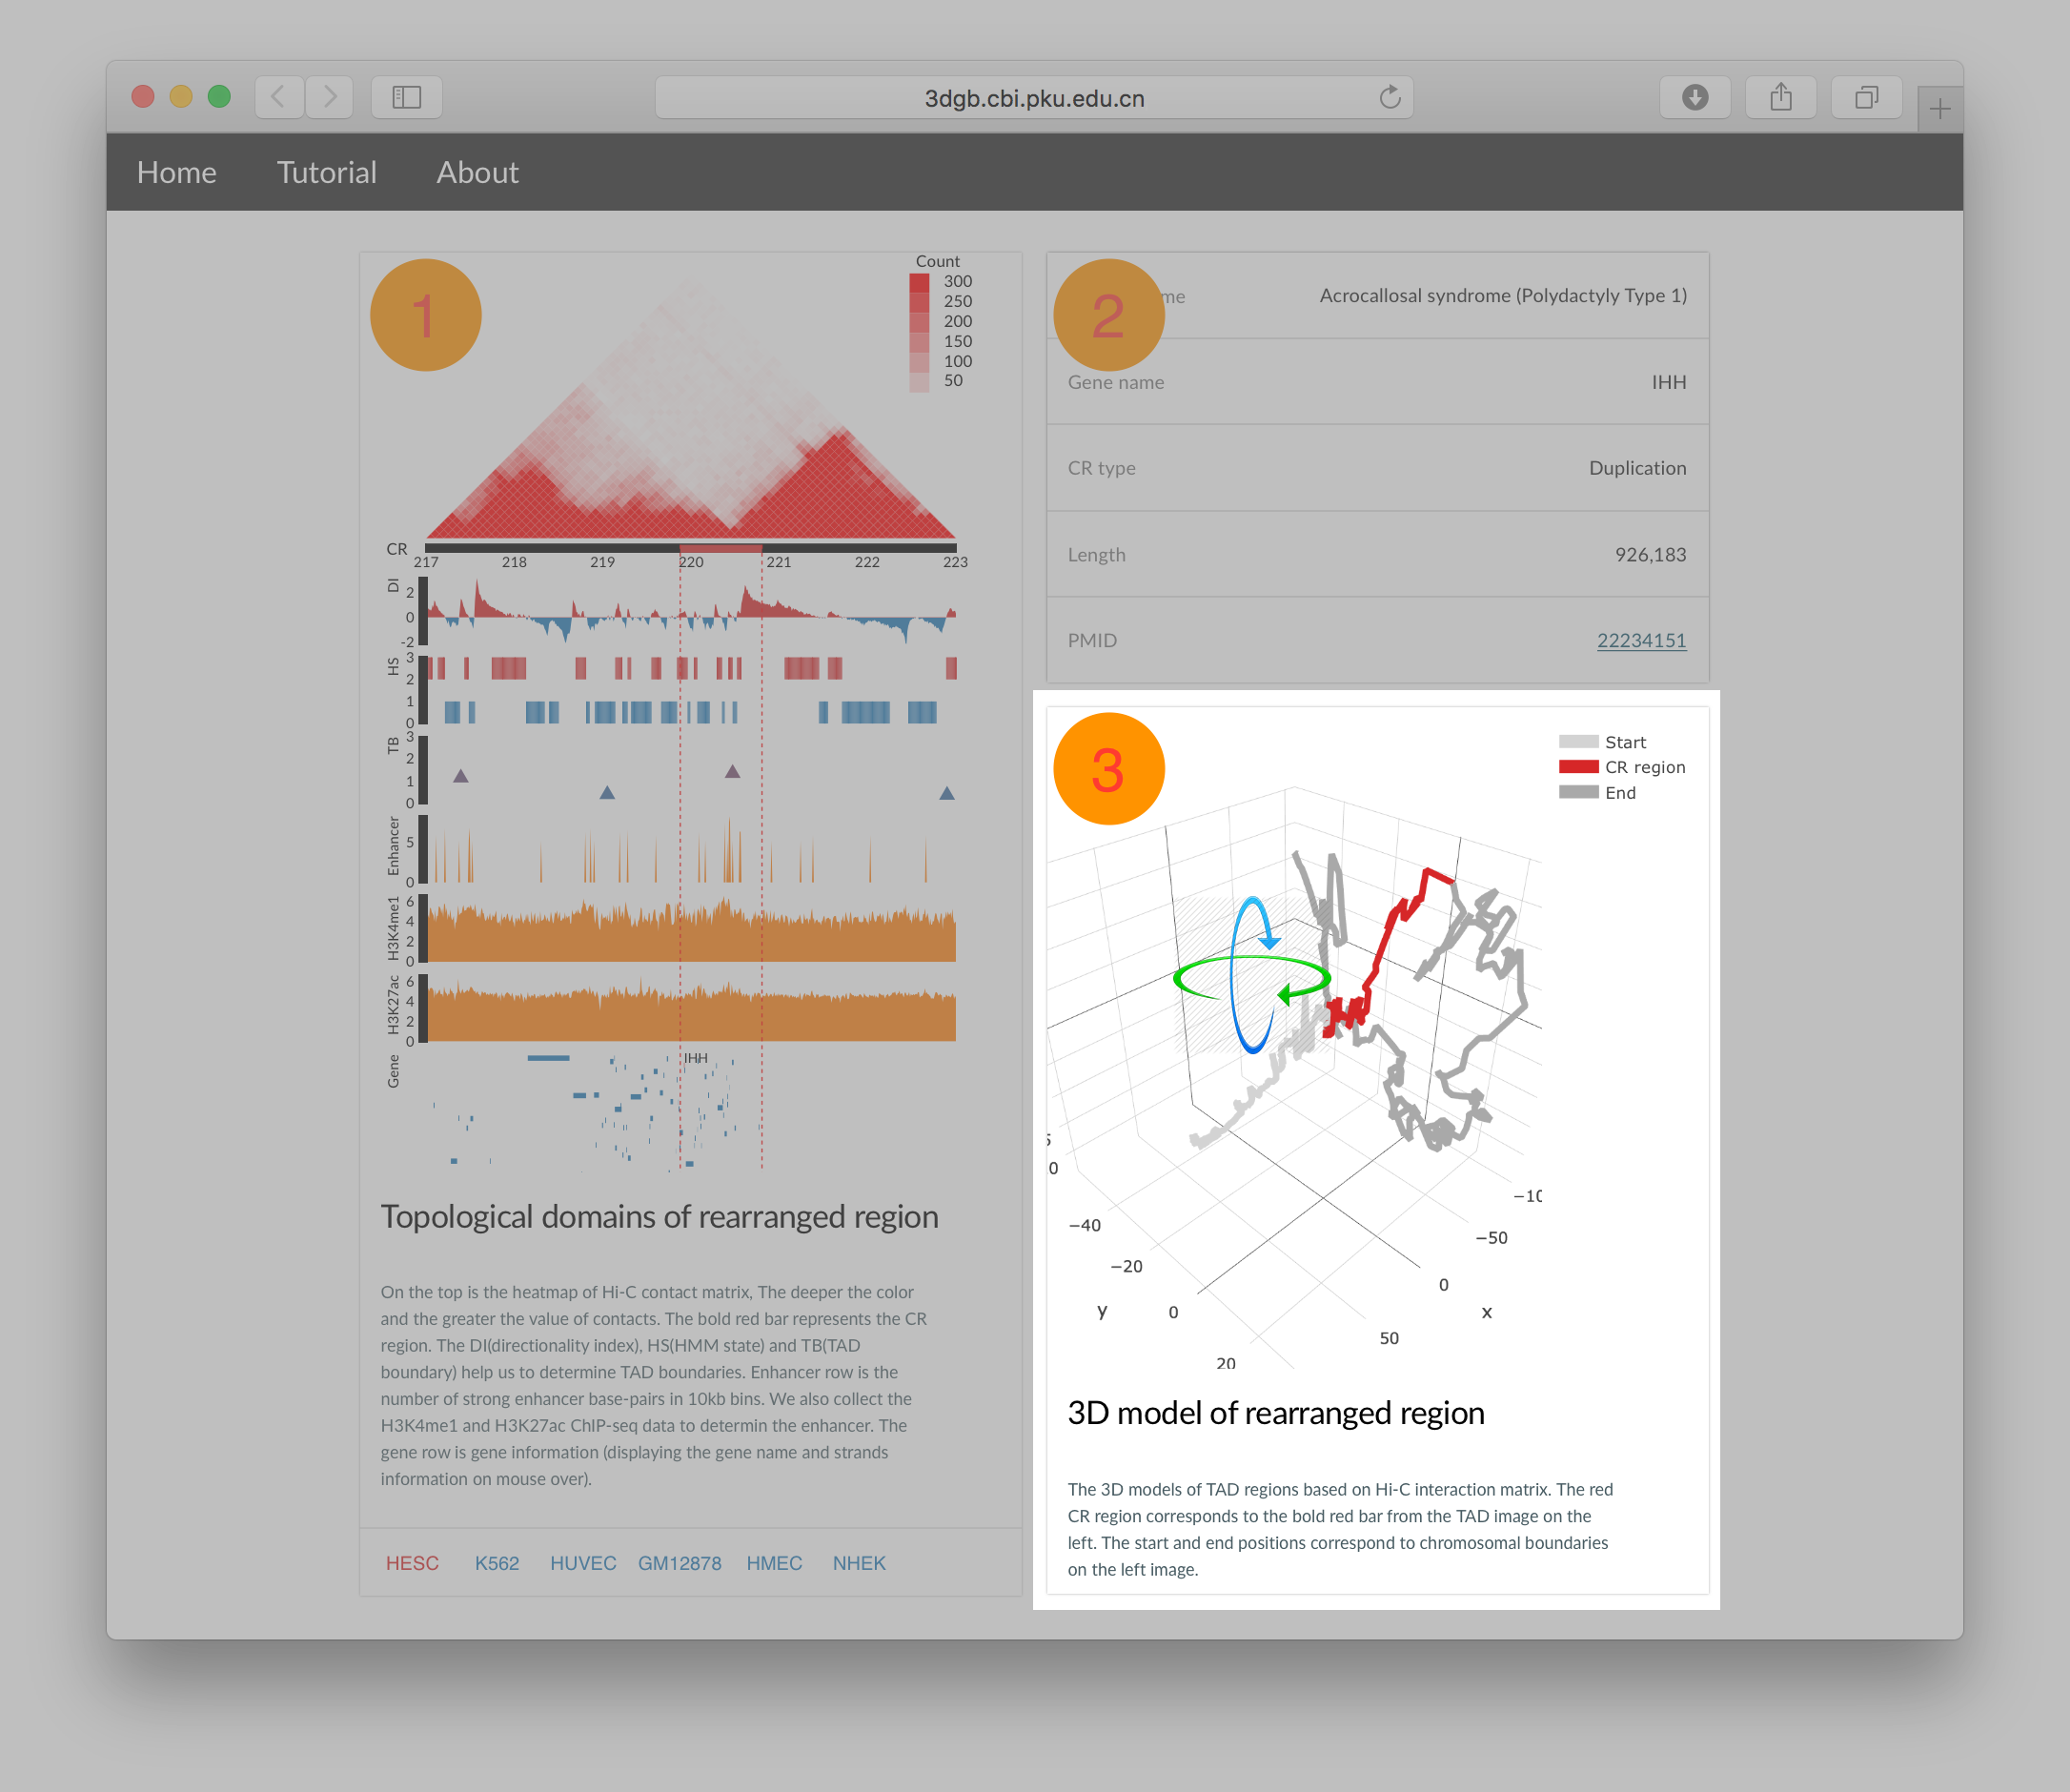
Moving mouse over the 3D chromosome model will show chromosomal locations. Dragging the mouse will rotate the 3D model.